Climate Atlas of Iceland
The Climate atlas
The Climate Atlas of Iceland was developed to promote Iceland's resilience to climate change and its effects. The climate atlas is a formal channel of recognized scenarios of how climate change will affect Iceland, and it provides insights into the possible future, which determines policy formulation and decision-making. The atlas contains data and projections of what can be expected in relation to global warming throughout the 21st century.
The Climate atlas of Iceland is an interactive graphical tool where you can view and obtain data related to the impacts of climate change on the local communities and regions in Iceland. The information from the atlas can be used to assess how sensitive the local communities are to climate change and the potential risks associated with it. The atlas is therefore an important tool for policymaking and decision-making regarding adaptation measures to climate change with a changing future in mind.
The Climate Atlas of Iceland is based on the scenarios defined by the United Nations’ Intergovernmental Panel on Climate Change (IPCC) for global greenhouse gas emissions. The data published in the atlas have been recalculated, adjusted, and downscaled for Iceland and the surrounding ocean. The atlas provides information on the impact of different emission scenarios on temperature, precipitation and sea level rise in Iceland by the end of the century. The data in the atlas is open and accessible to everyone. It can be viewed graphically through interactive features, as well as being downloadable in various formats.
What are emission scenarios?
Emission scenarios are projections or models that describe how greenhouse gas (GHG) emissions might evolve over time based on different assumptions about factors such as population growth, economic development, technological advancements, energy production, and policy decisions. The increase in greenhouse gas emissions changes the fate of thermal radiation in the atmosphere. Solar radiation passes through the atmosphere reaching the Earth’s surface and is absorbed by land, water, and vegetation before being re-emitted in the form of longer-wave radiation. Greenhouse gases can absorb a part of the thermal re-emitted radiation and trapping it leading to an increase in the temperature of the surrounding air and the Earth's surface, which is known as the “greenhouse effect.” The projections provide a range of potential climate outcomes, based on a set of Shared Socioeconomic Pathways (SSPs) provided by the Intergovernmental Panel on Climate Change (IPCC). Each SSP scenario offers different possibilities for the development and increase of radiative stress until the end of the 21st century. The Icelandic Meteorological Office is responsible for presenting scenarios for the development of the climate in Iceland in the future. This is done by compiling the results of numerous climate models that calculate temperature and precipitation changes based on different levels of global greenhouse gas emissions. The scenarios that are most commonly used are three; SSP2-4.5, SSP3-7.0 and SSP5-8.5. When examining coastal flooding, two scenarios are used; SSP5-8.5 and SSP5-8.5 (low confidence; LC).
What do emissions scenarios represent?
The mildest scenario (SSP2-4.5) assumes that greenhouse gas emissions will continue at a similar rate to 2024, peak around mid-century and then slowly decline.
The medium scenario (SSP3-7.0) assumes that greenhouse gas emissions will increase in line with the trend of recent decades and will be twice as high as in 2024 by the end of the century.
The most extreme scenario (SSP5-8.5) assumes that the value of greenhouse gases in the atmosphere will double from the current level by 2025. Projections related to scenarios of this high emission show drastic or more exaggerated changes than otherwise.
A separate scenario has been presented for the projections of coastal flooding, scenario SSP5-8.5LC. This scenario is comparable to scenario SSP5-8.5 except that this scenario assumes much greater melting of the Antarctic ice sheet, but there is a high degree of uncertainty about its development.
Climate indicators
The Climate Atlas of Iceland provides insight into how the climate in Iceland could change by the end of the century. It is based on data from climate models that have been adjusted for Iceland. The atlas includes information on changes in temperature, precipitation and sea level for different scenarios for global greenhouse gas emissions. In this way, the atlas helps us understand how the climate could develop and how we can prepare for the future.
The atlas provides information on:
- •
Three scenarios for Iceland: "Shared Socioeconomic Pathways" (SSP), i.e. SSP2-4.5, SSP3-7.0 and SSP5-8.5
- •
The whole year, winter (December, January, February), summer (June, July, August), spring (March, April, May) and autumn (September, October, November)
- •
Three future periods (beginning of the century 2015–2040, middle of the century 2041–2070, and end of the century 2071–2100)
- •
Spatial averages for all of Iceland and calculated values in 110 places from 1950 to 2100
- •
Potential extent of a storm surge with return periods of 20-, 50-, and 200-year (5%, 2%, and 0.5% annual probability of occurrence) at 77 coastal locations in Iceland
In the atlas, values are compared to the reference period 1981-2010.
Climate data for the atlas
The climate data used for the Climate Atlas of Iceland consists of an ensemble of 15 models available from the NEX-GDDP-CMIP6 dataset[1]. All models were statistically downscaled and bias-adjusted using the Copernicus Arctic Regional Re-analysis (CARRA) as reference data before calculating and deriving the relevant indicators.
A set of climate indicators were derived from the statistically downscaled and bias-adjusted climate variables both annually and seasonally for each of the models. Each climate indicator was calculated as an absolute value and as change (percentage and/or absolute change) relative to the chosen reference historical period (1981–2010) for three future scenarios, i.e., SSP2-4.5, SSP3-7.0, and SSP5-8.5. For the future scenarios, three periods were defined: the beginning of the century (2015–2040), middle of the century (2041–2070), and the end of the century (2071–2100). Unlike the temperature and precipitation related climate variables/indicators, storm surges or coastal flooding events with 20-, 50-, and 200-year return period (i.e., events that have a 5%, 2%, and 0.5% annual probability of occurrence) were calculated for the current period, and for the years 2100 and 2150 for two emissions scenarios SSP5-8.5 and SSP5-8.5 with low confidence (SSP5-8.5LC). To present representative results in the atlas that capture the range and spread of the results from the different climate models, summary statistics were calculated for each indicator. For each climate variable/indicator, the mean value, median value (50%), the upper 90th percentile, and the lower 10th percentile values of the ensemble of models used were calculated both on an annual and seasonal basis. The summary statistics are presented as a time series, but maps are only shown for the mean value for the different pre-defined time periods (beginning, middle, and end of the century). The derived temperature, precipitation, and coastal flooding-related indicators are presented and defined below in Table 1.
Table 1 Summary of the climate indicators in the Climate Atlas of Iceland, definitions, units, and seasons.
| Variable/indicator | Unit | Description | Season |
| Mean daily air temperature | °C | Mean daily near-surface air temperature for the selected period | The whole year, winter, summer, spring, or autumn |
| Mean daily maximum air temperature | °C | Mean of daily maximum near-surface air temperature for the selected period | The whole year, winter, summer, spring, or autumn |
| Mean daily minimum air temperature | °C | Mean of daily minimum near-surface air temperature for the selected period | The whole year, winter, summer, spring, or autumn |
| Extreme temperature range | °C | Range between the maximum of daily maximum temperature and the minimum of daily minimum temperature for the selected period | The whole year, winter, summer, spring, or autumn |
| Growing season length | Day | Annual number of days between the first occurrence of at least 6 consecutive days with mean daily temperature over 5.0 °C and the first occurrence of at least 6 consecutive days with mean daily temperature below 5.0 °C, occurring after July 1st | Annual |
| Number of frost days | Day | Annual number of days where the daily minimum temperature is below 0 °C | Annual |
| Daily freeze-thaw cycles | Day | Annual number of days with a diurnal freeze-thaw cycle, where maximum daily temperatures are above 0 °C and minimum daily temperatures are at or below 0 °C | Annual |
| Mean daily precipitation | mm/d | Mean of daily precipitation for the selected period | The whole year, winter, summer, spring, or autumn |
| Total accumulated precipitation | mm | Total accumulated precipitation calculated as the sum of daily precipitation for the selected period | The whole year, winter, summer, spring, or autumn |
| Maximum 1-day precipitation | mm | Maximum 1-day precipitation for the selected period | The whole year, winter, summer, spring, or autumn |
| Maximum 5-day precipitation | mm | Maximum 5-day accumulated precipitation for the selected period | The whole year, winter, summer, spring, or autumn |
| Number of dry days | Day | The number of days with daily precipitation under 1.0 mm/day for the selected period | The whole year, winter, summer, spring, or autumn |
| Dry spell total length | Day | The Number of days in dry periods of 3 days or more, during which the total precipitation within windows of 3 days is under 3.0 mm for the selected period | The whole year, winter, summer, spring, or autumn |
| 20-year flood | - | Possible extent of a sea flood that has a 20-year return period (5% annual probability) | - |
| 50-year flood | - | Possible extent of a sea flood that has a 50-year return period (2% annual probability) | - |
| 200-year flood | - | Possible extent of a sea flood that has a 200-year return period (0.5% annual probability) | - |
Navigating the atlas
In this section, a detailed description of the contents of the Climate Atlas of Iceland is presented. In the start page, a small introductory description of the atlas is shown on the right side of the map. To be able to navigate the atlas, one can click on Opna loftslagsatlas button or the expand symbol on the map.
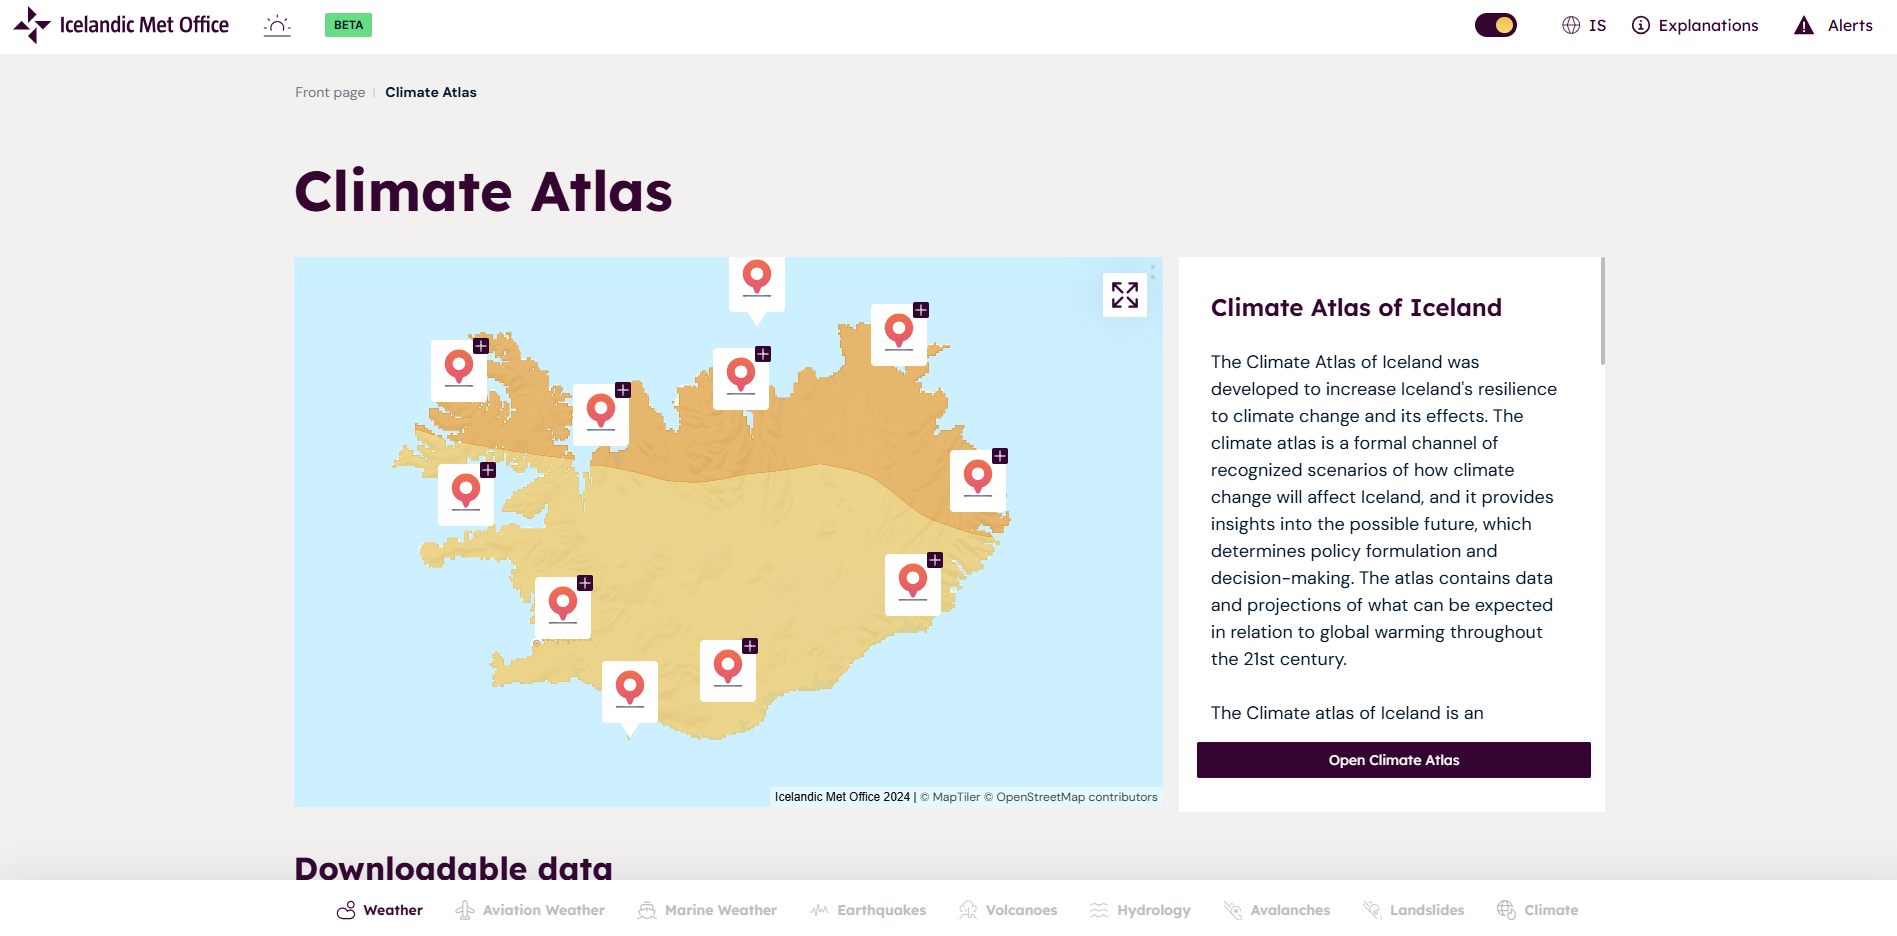
Figure 1 Screenshot of the start page of the Climate Atlas of Iceland.
Once the atlas is open, the top panels include the dropdown menus from which one can select to visualize the climate variables/indicators annually or seasonally, for different scenarios, and at various locations around Iceland.
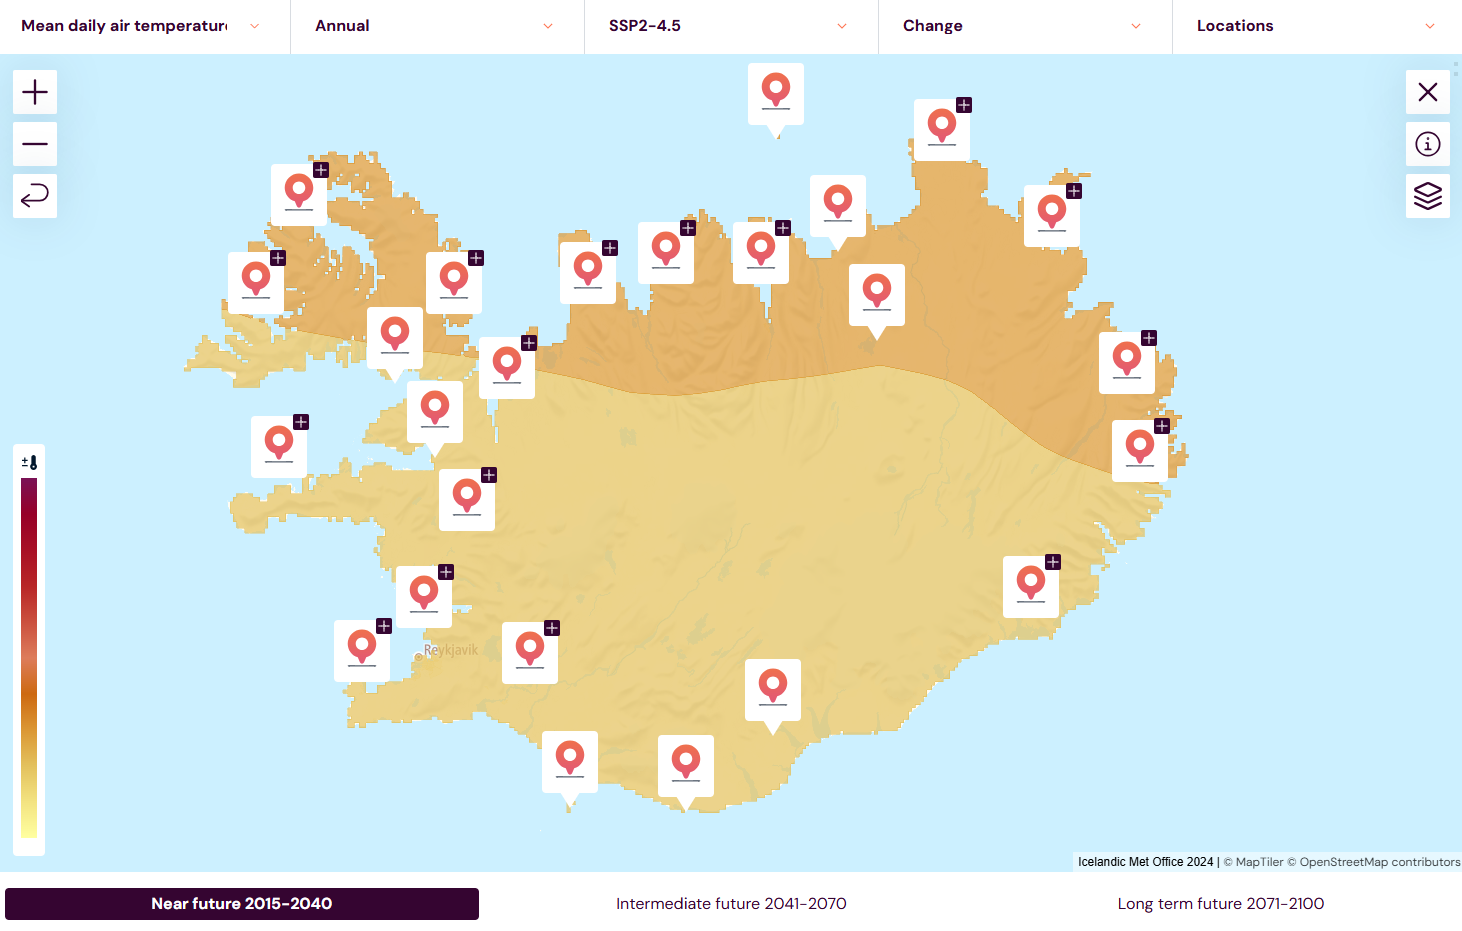
Figure 2 Screenshot of the Climate Atlas of Iceland before selecting any indicator.
Drop down menus and the variables
To select an indicator, one can click on the first menu in the top left corner (loftslagsvísar), which includes all the climate variables/indicators under three main categories: Temperature, precipitation, and sea flooding.
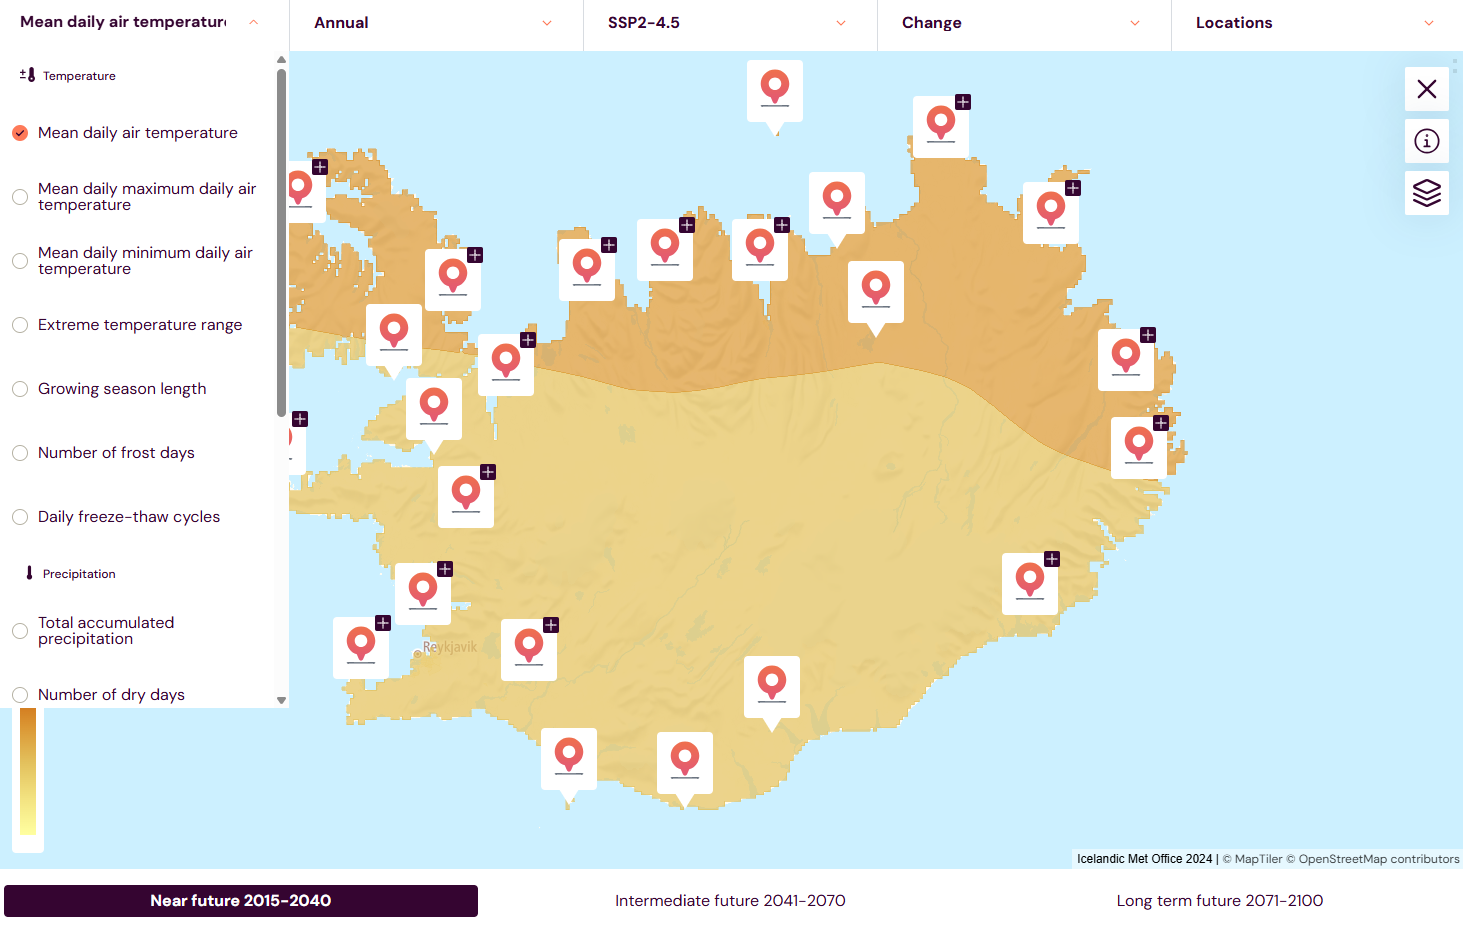
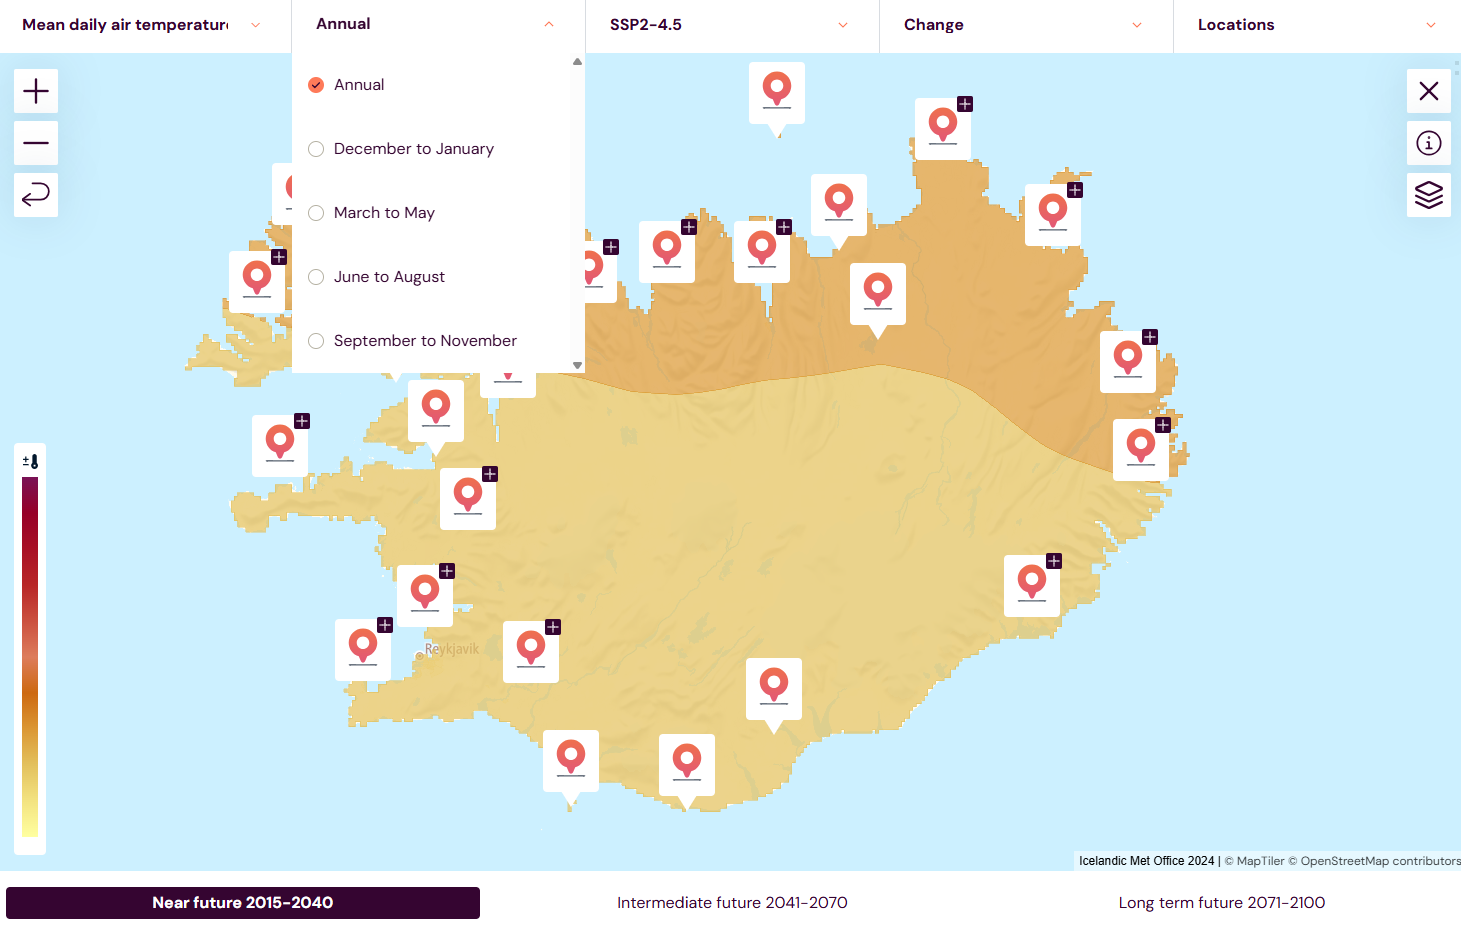
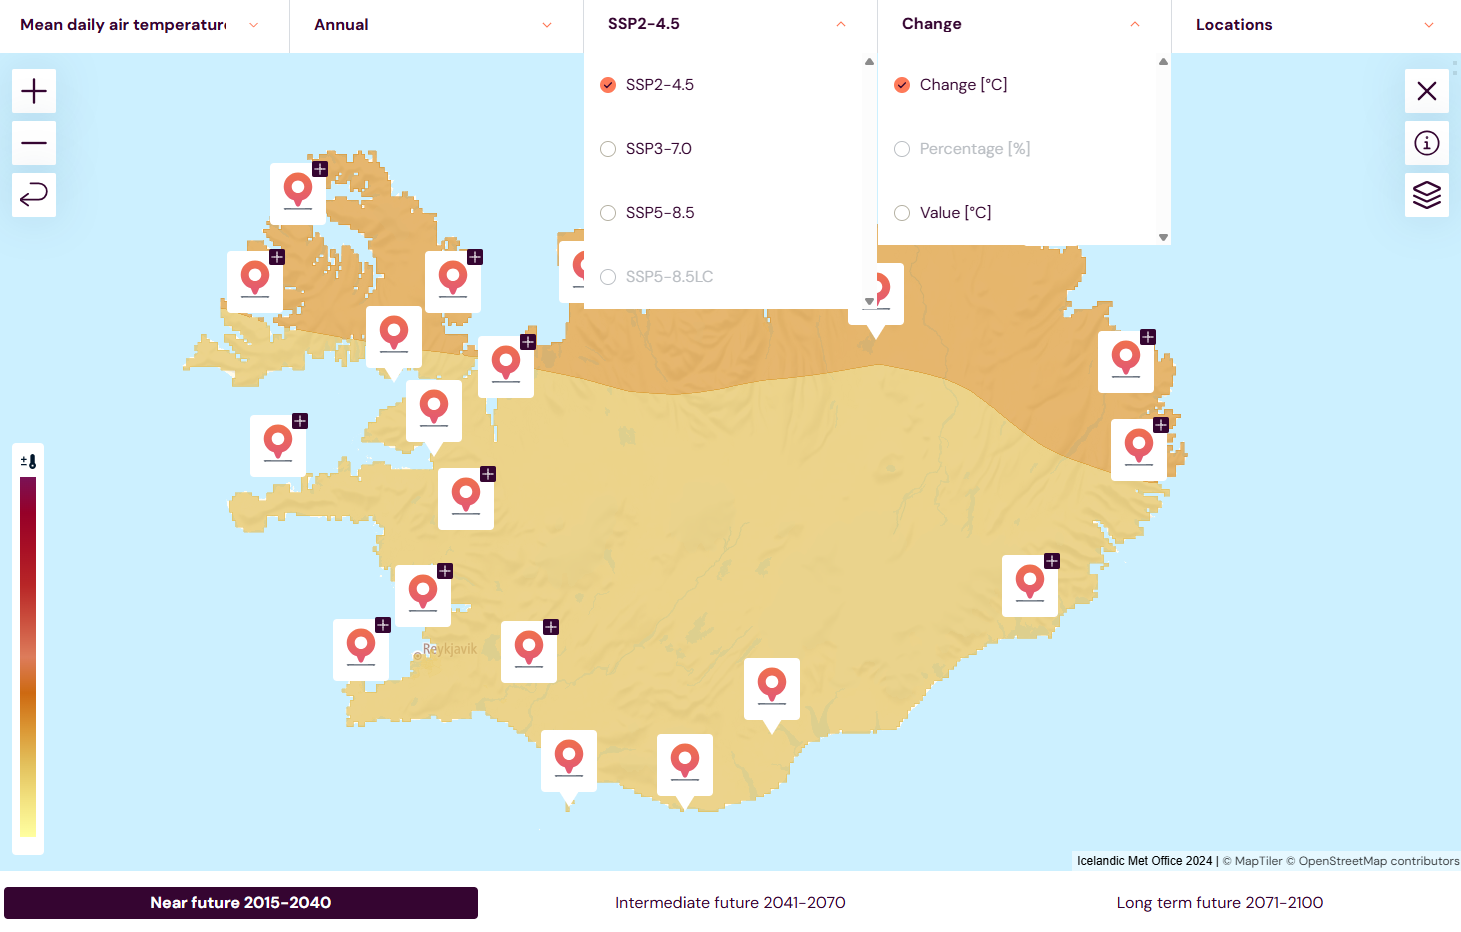
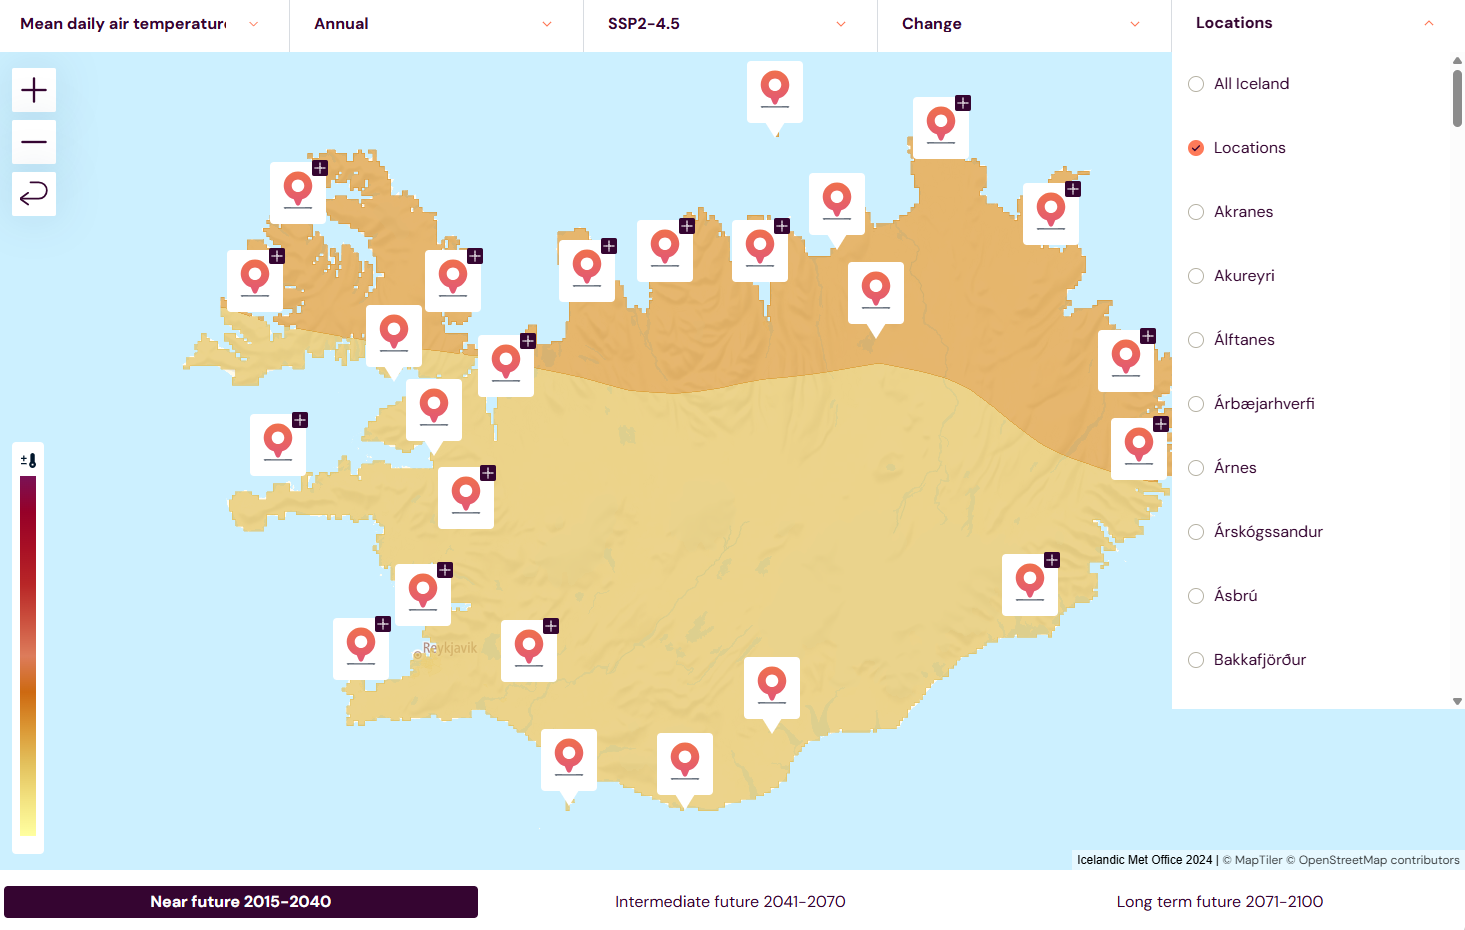
Figure 3 Screenshot showing the dropdown menus in the atlas.
From the second menu, one can choose to view the data for the whole year or for a specific season.
The third menu contains the different scenarios.
From the fourth menu one can choose to view the value, the change in the value relative to the reference period or the percentage change relative to the reference period.
On the far right of the menu, where it says “region,” you can choose whether to view information for Iceland as a whole or for specific regions. The atlas can display data for 110 urban areas in Iceland regarding temperature and precipitation, and for 77 regions regarding coastal flooding.
At the bottom of the page one can select to view the values for three periods defined as the beginning of century (2015–2040), middle of the century (2041–2070), and the end of the century (2071–2100).
For an example, the photo below shows the selection of the mean temperature, for the whole year, for the scenario SSP2-4.5, selecting to visualize the median value, for the end of the century period.

Figure 4 Screenshot showing the visualization of the mean temperature map for the whole year, for the scenario SSP2-4.5, as an absolute value (median), and at the end of the century (2071–2100).
Details and data
In this example, Vík was chosen to take a closer look. Two graphs appear in a panel that opens up upon selection showing in the upper graph the calculated values (mean, median, and the shaded area representing the 10–90% limits of all models), and in the lower graph all of the models used, both for the entire period including the historical and the future period (i.e. from 1950 to 2100). The selected period from the bottom options (in this case it is the end of the century period) is also highlighted in blue in these graphs.
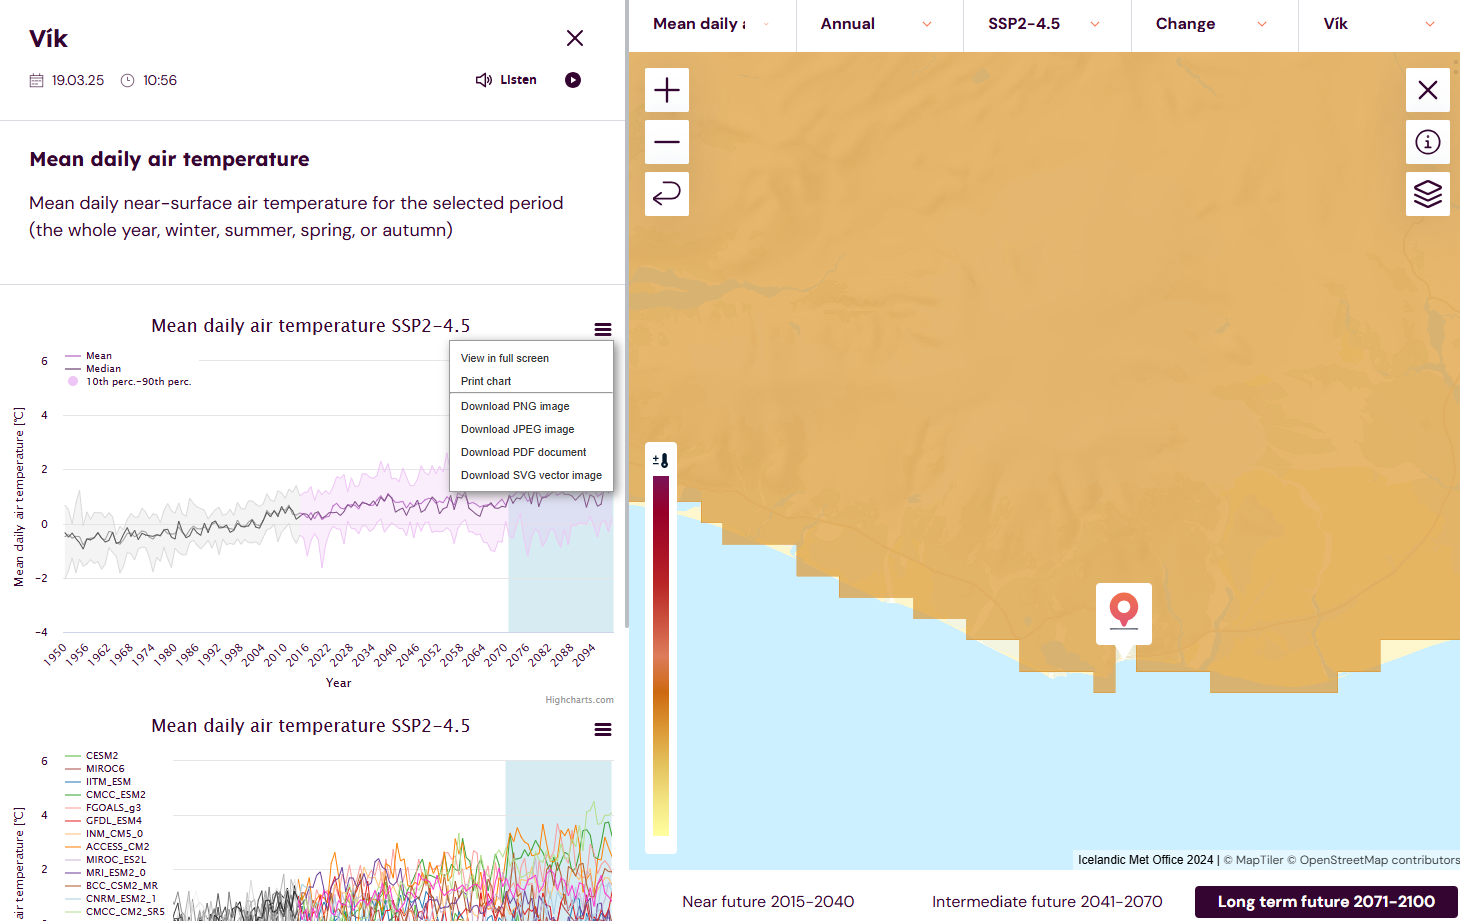
Figure 5 Screenshot showing the temporal evolution of the mean temperature in Vík as summary statistics (upper graph on the left), and for all the models (lower graph on the left). The mean temperature in Vík is shown for the whole year, and for the SSP2-4.5 scenario.
Next to both graphs, one can click on the menu symbol, which provides multiple options for data visualization. This includes viewing the graphs in full screen mood, directly printing the graphs, downloading the graphs in PNG, JPEG, PDF or SVG formats.
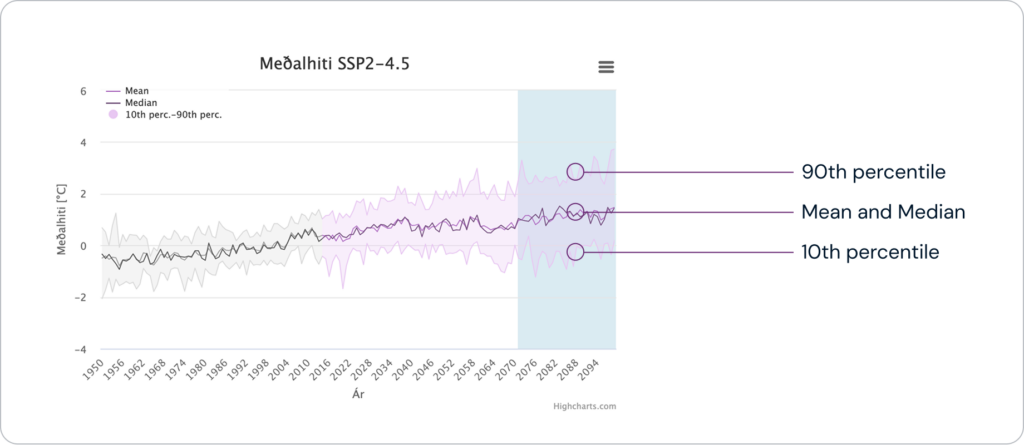
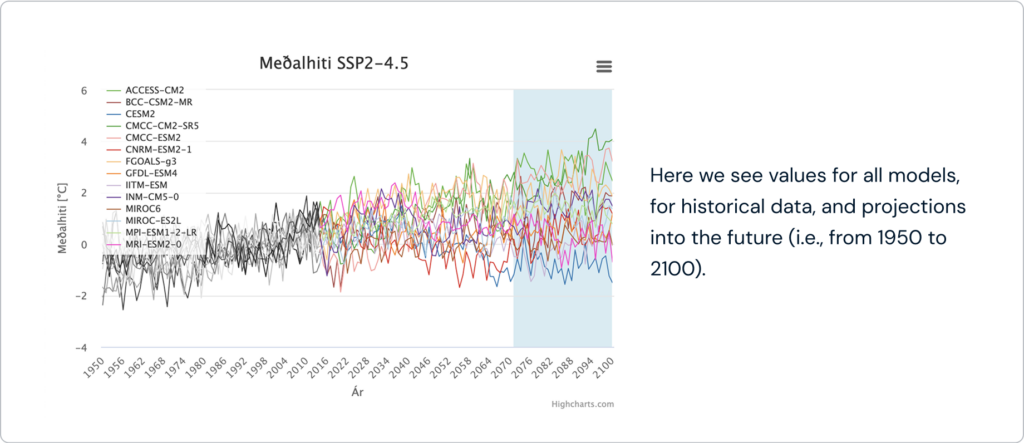
Figure 6 Screenshot showing the downloaded graphs from the atlas.
The data can also be downloaded as CSV (.csv) and Excel (.xlsx) files from a special button below the graphs in CSV or Excel format.
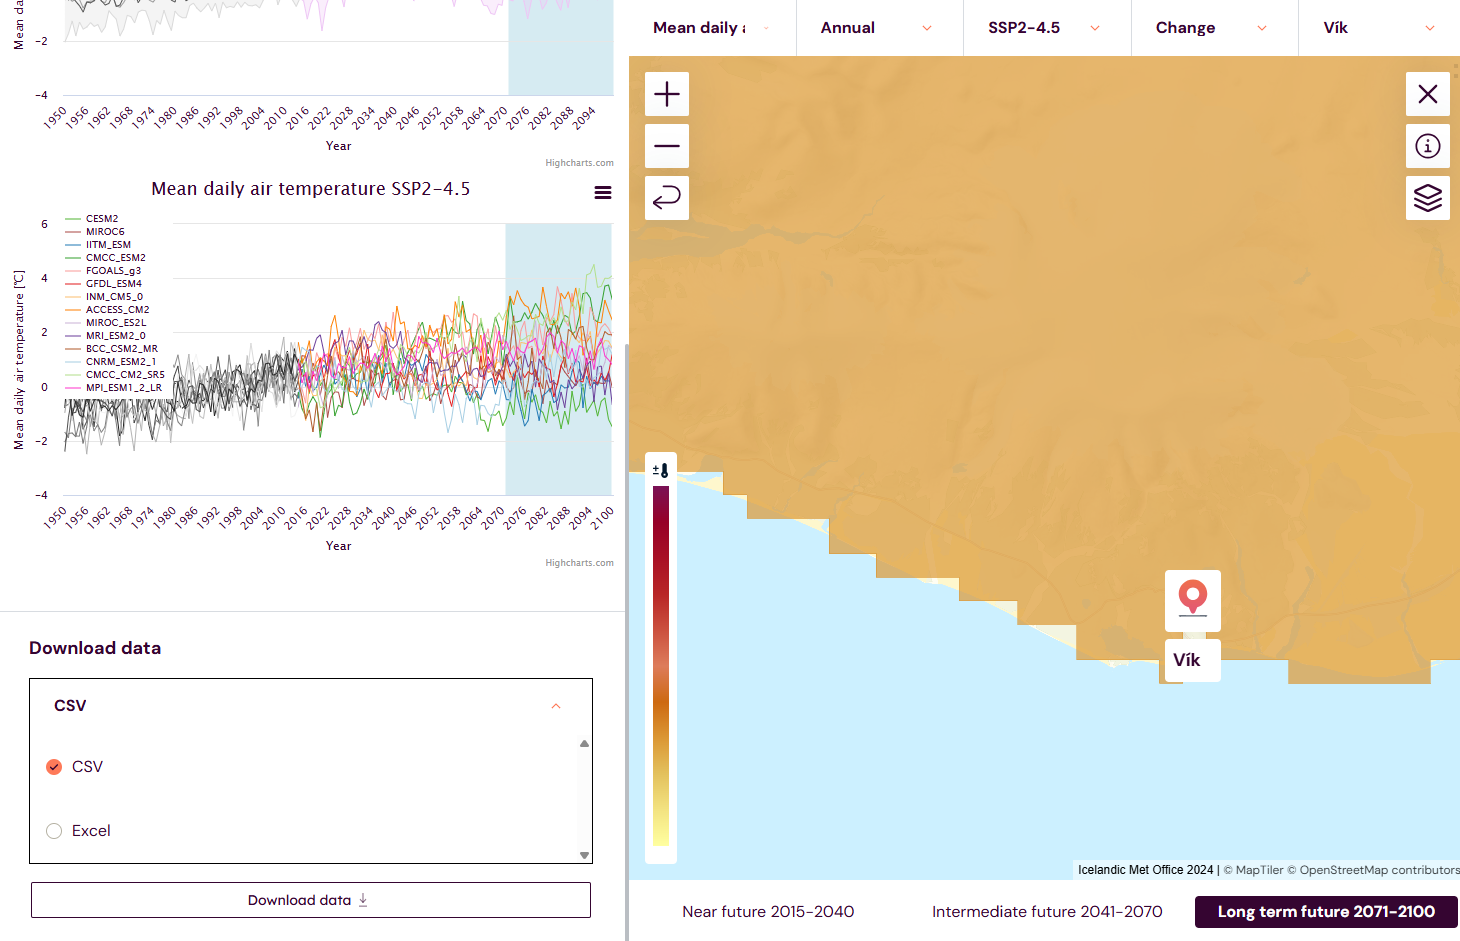
Figure 7 Screenshot showing the dedicated downloading option for the data.
The tables below show CSV files containing figures for average temperatures in Vík for the year as a whole and scenario SSP2-4.5, on the one hand as summary statistics (mean, median, 10th and 90th percentiles) and on the other hand for all models.
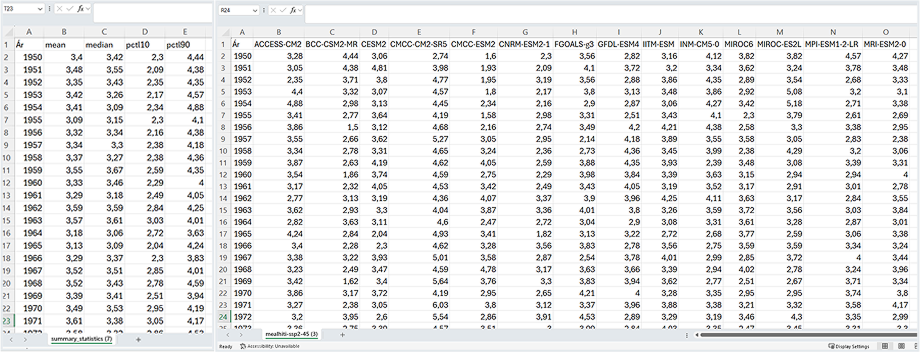
Figure 8 Screenshot showing the downloaded data for the mean temperature at Vík for the whole year, for the scenario SSP2-4.5, as an absolute value. On the left, is the summary statistics (mean, median, 10th, and 90th percentiles) and on the right the data for all models is shown. The two files are downloaded in CSV format from the atlas.
A closer look at sea flooding
The extent of storm surges (sea flooding) with 20-, 50-, and 200-year recurrence interval for the current period, the year 2100, and the year 2150 for two scenarios (i.e., SSP5-8.5 and SSP5-8.5LC) can be visualized under the climate indicator “sea flooding.” In Figure 9, an example of the flood extent of a 20-year event for the current period is shown.
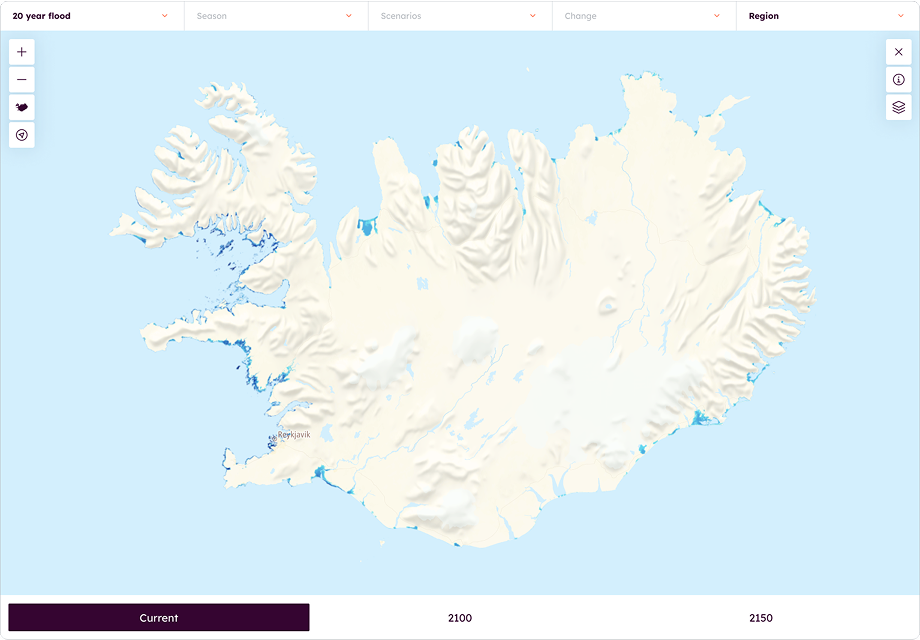
Figure 9 Screenshot of the storm surge extent for the current period for a 20-year event in Iceland.
When choosing to show the same indicator (20-year flood) for the year 2100, in this example, one can choose from two possible scenarios (SSP5-8.5 and SSP5-8.5LC) as shown in the next image.
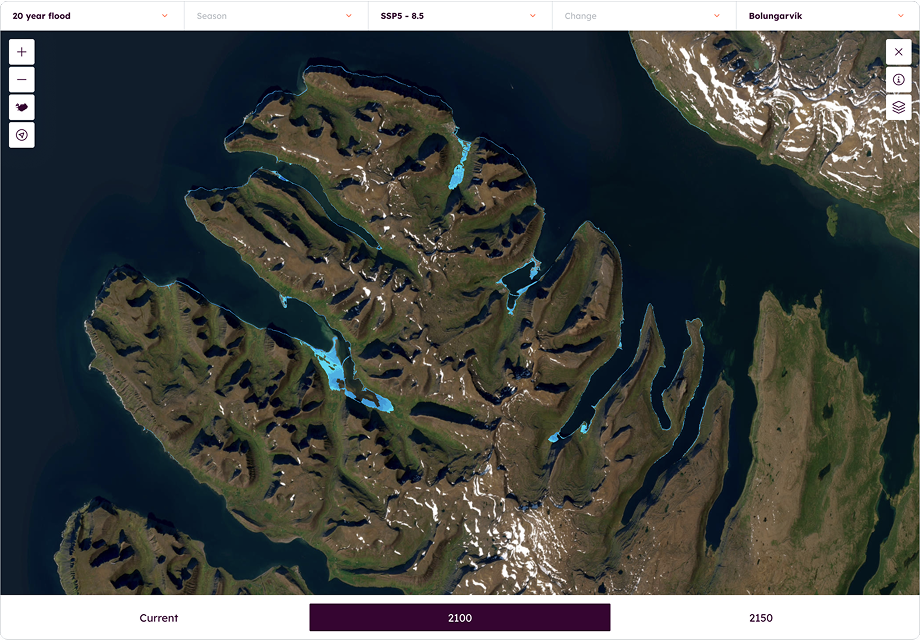
Figure 10 Screenshot of the storm surge extent for the year 2100 for a 20-year event and the scenario SSP5-8.5 in Iceland.
To visualize the flood extent in more detail and at specific locations, one can select a city/town from the area dropdown menu to get a zoomed in graph (see Figure 11). In this example, the 20-year flood extent for the scenario SSP5-8.5 for the year 2100 at Bolungarvík can be viewed in a side panel that appears upon the selection of the location.

Figure 11 Screenshot showing a close-up map of the 20-year flood extent for the year 2100, the scenario SSP5-8.5 at Bolungarvík.
[1] https://www.nccs.nasa.gov/services/data-collections/land-based-products/nex-gddp-cmip6